MDAS-Pro Software
Software for Multi-Use Loggers.
Description
Centralized Monitoring:
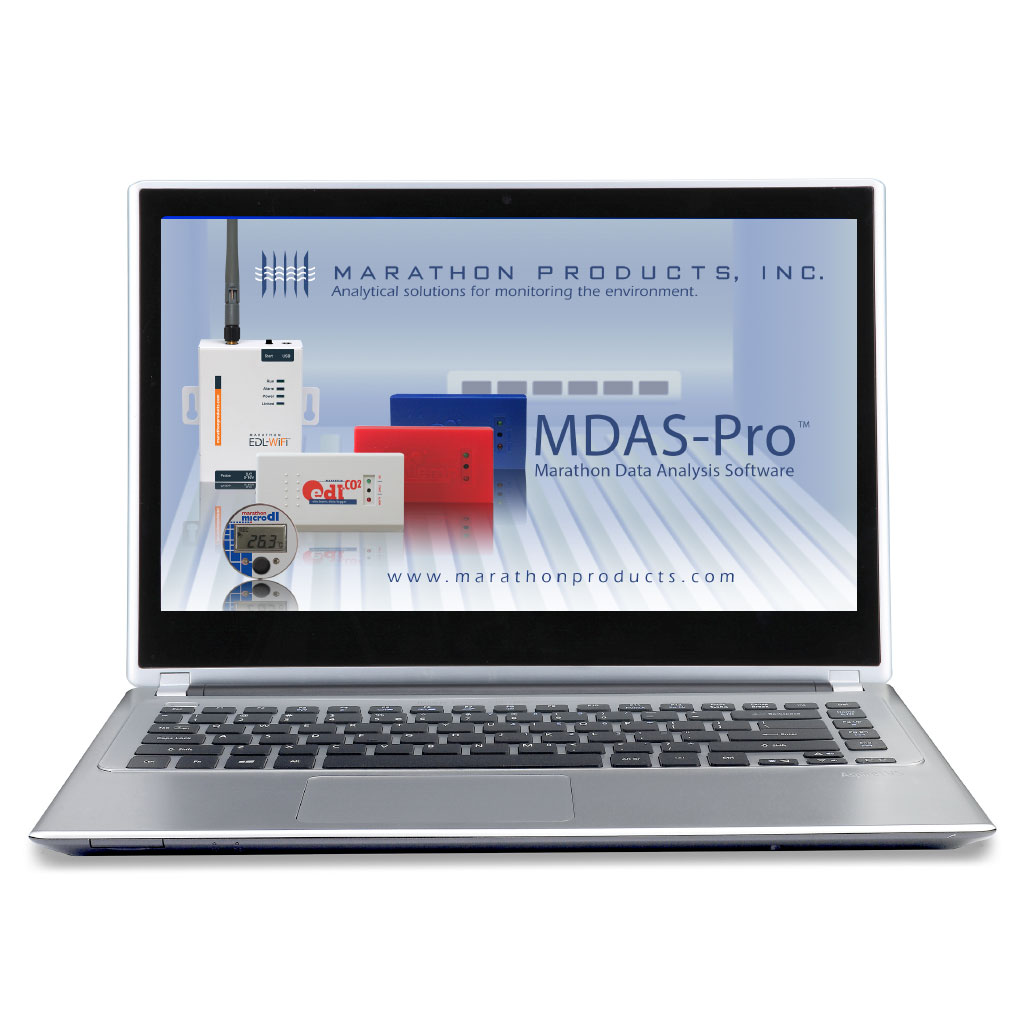
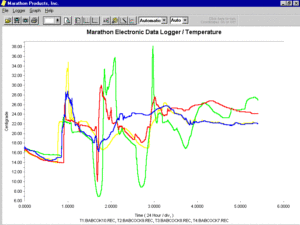
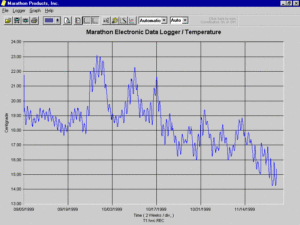
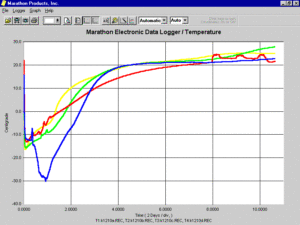
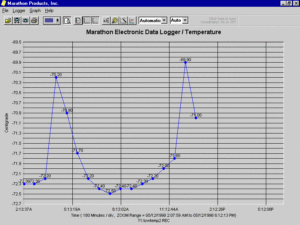
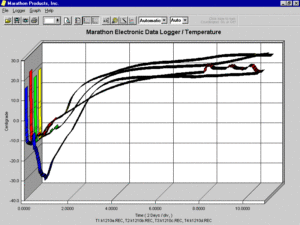
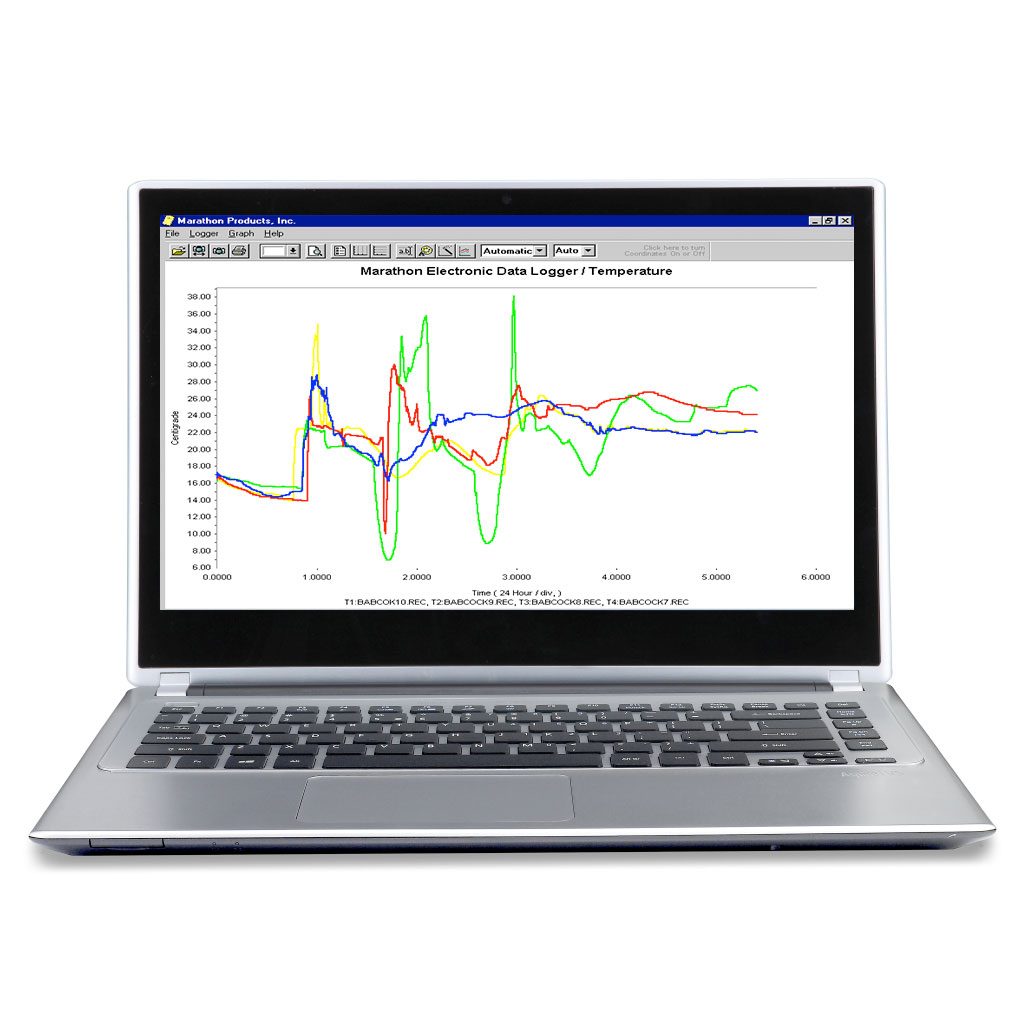
Marathon’s Data Analysis Software (MDAS) is a desktop application that allows you to view up to 16 multiple traces at one time, enables you to transfer the information recorded in the logger to your computer, and to view, print and generate a report of the measurement data. The graphic representations include rotating 3D views, unlimited zooms, view temperature data points on the graph, view the total elapsed time or the exact time when it was recorded.
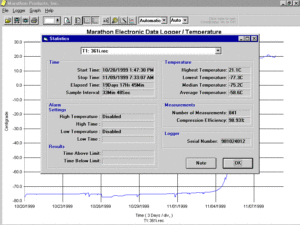
The graph and all data points (date, time and temperature) can be printed, as well as the ability to add a Note to the file for including information pertinent to that graphic trace. Users have the ability to view the numeric data within a screen window, calculate the Mean Kinetic Temperature of the recording as well as export data in a CSV format. A summary report showing the Start and Stop Time, High, Low, Median and Average temperatures as well as the Alarm information is also displayed. The data from the logger is downloaded to your PC via our proprietary interface cable or USB interface.
Our MDAS-Pro software is the ideal solution for managing and analyzing data from multiple data loggers from multiple locations. With IP Address access MDAS-Pro is location independent so data loggers with network access, located anywhere, can be centrally monitored and managed.
MDAS-Pro offers language support for English, French, German, Portuguese and Spanish. A separate installation program for Chinese and Japanese is also available on the CD-ROM with this version of the software. The software has been designed for the Microsoft operating system platforms and is compatible with Windows XP, Vista, 7, 8 and 10.
See our MDAS Read-only software for use with our single-use data loggers.

